Step 1: Create an instrumentation file
Install dependencyCreate a file e.g. instrumented.ts and update the config
1npm i @otelic/open-telemetry1process.env.OTELIC_API_KEY = "Get your free API KEY at https://app.otelic.com";
2process.env.OTELIC_APP_NAME = "NodeJS App";
3process.env.OTELIC_SERVICE_NAME = "My Service";
4process.env.OTELIC_SERVICE_VERSION = "v1";
5
6import "@otelic/open-telemetry";Step 2: Load instrumentation before your main app using -r
Update your package.json scripts:If already loading other modules, add instrumentation as first:
1{
2  "scripts": {
3    "start": "node -r ./instrumentation.ts app.ts"
4  }
5}1node -r ./instrumentation.ts -r ./otherSetup.ts app.tsStep 3: View logs, traces & alerts at Otelic
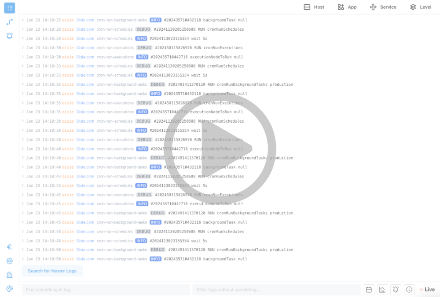
Check your logs, set up alerts, and explore traces at:app.otelic.com
Bonus: Continue using console logs as usual
The package captures your existing console logs automatically:These logs will be searchable on Otelic.
1console.log("Hello");
2console.info("Info message");
3console.warn("Warning");
4console.error("Error");
5console.debug("Debug message");Happy debugging 🎉
Resolve your LOGS & TRACES issues within minutes
Developer-friendlyquick setup
gRPC & HTTPS support out of the box
Just add Otelic to yourOpenTelemetry collector
Otelic.com is built on top of the open-source market's best tooling for logs & traces: Open Telemetry. Just follow the OpenTelemetry guides and point your logs & traces exporters to Otelic endpoints, using the x-api-key header to authorize requests. Otelic supports various languages and platforms, including JavaScript, C++, C#, .NET, Erlang, Go, Java, PHP, Python, Ruby, Rust, and Swift. It supports standalone deployments, serverless environments, Dockerized setups, Kubernetes, and more.


