Debugging with Traces: A Guide to Otelic Traces
Traces are an essential tool for understanding what happens during a single execution of your application. With Otelic, tracing becomes simple, intuitive, and incredibly powerful for debugging and performance optimization. Let’s explore how traces work and how they can help you identify bottlenecks in your app.
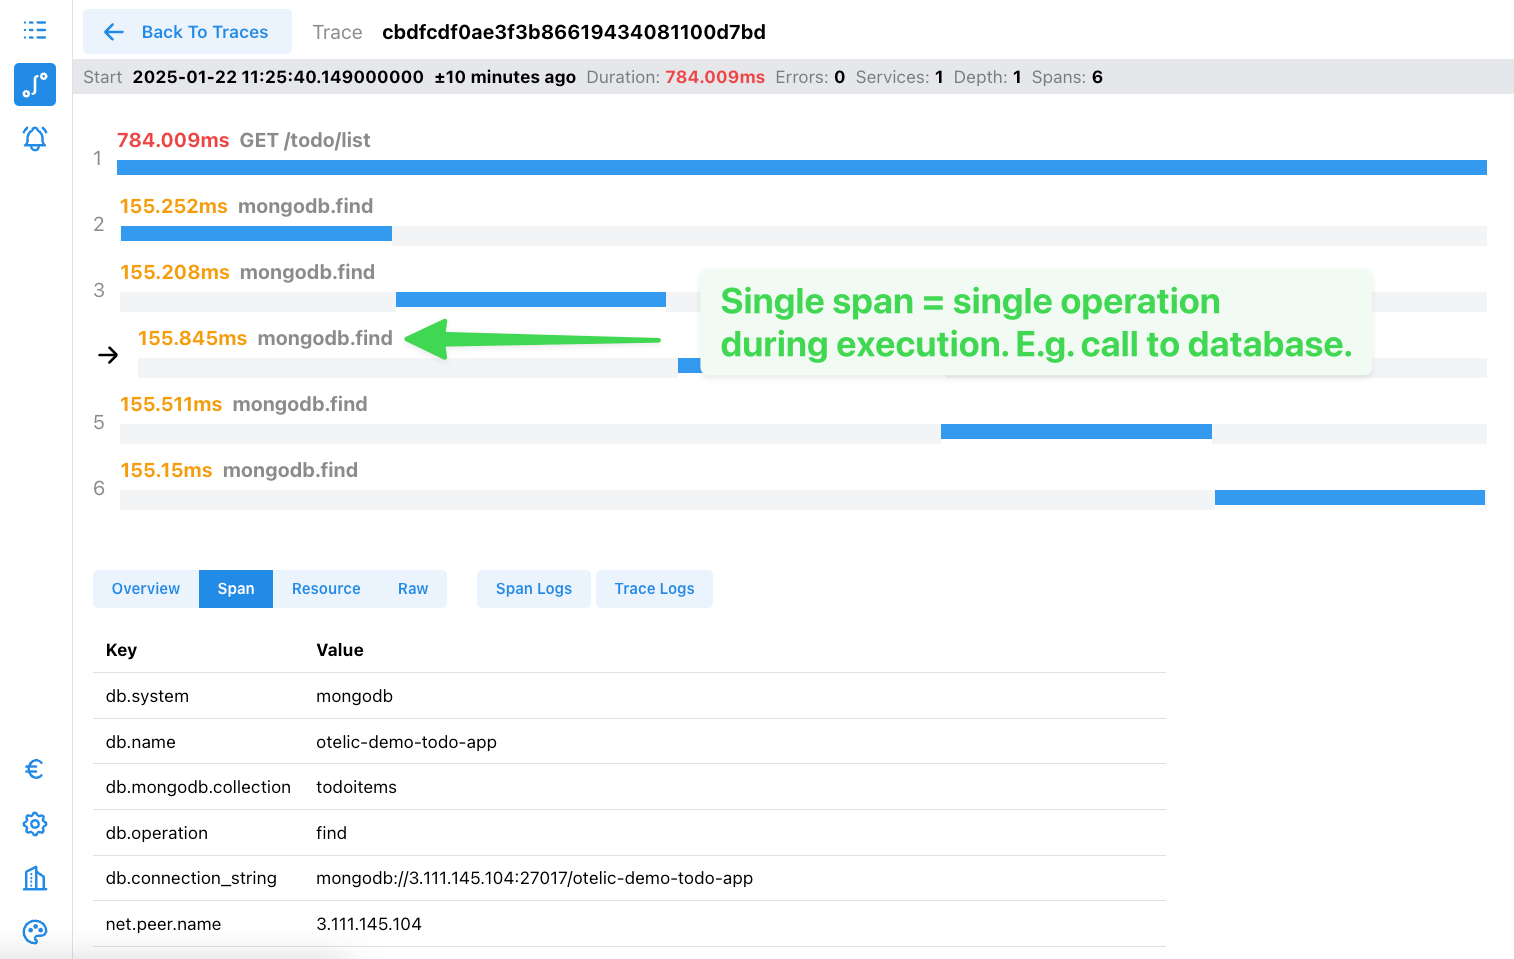
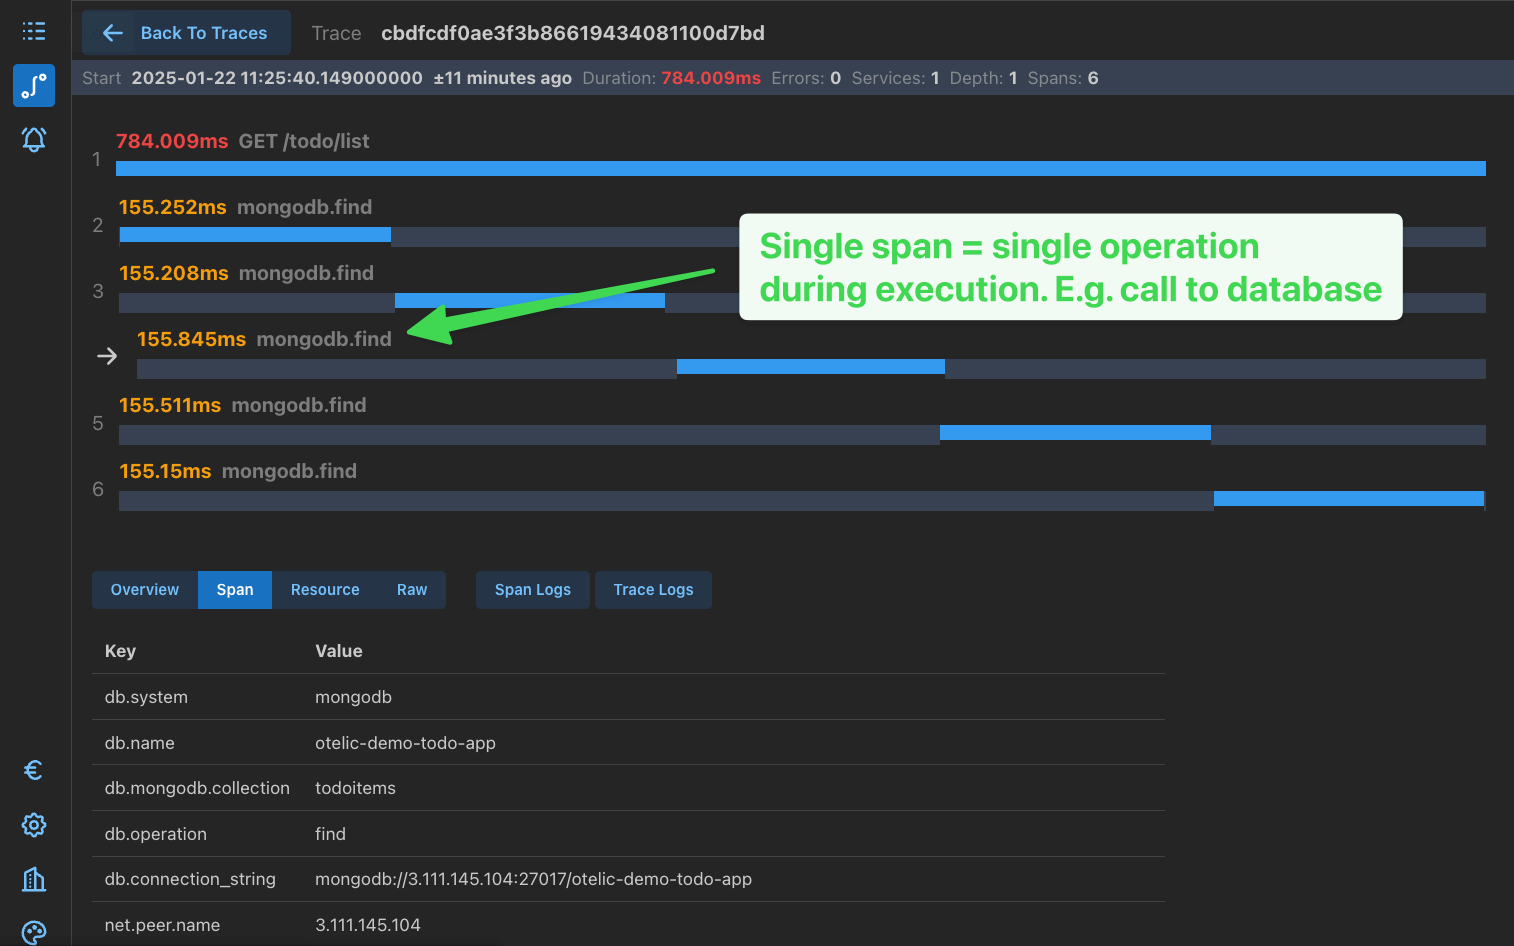
1. What Are Traces and Spans?
A trace represents the journey of a single request through your application, starting from an API endpoint. Within a trace, there are multiple spans, each representing a specific operation during the execution. For example:
- The trace begins when a user makes an API call to your endpoint.
- Each database query, external API call, or internal process creates a new span within that trace.
By looking at a trace, you can see how each operation contributes to the overall execution time.
2. Using Otelic to Debug with Traces
Otelic provides a clear and detailed view of traces to help you debug and optimize your application. Here’s how:
3. Real-World Example: Debugging with Traces
Let’s say you’re debugging a slow API endpoint in your application. Using Otelic:
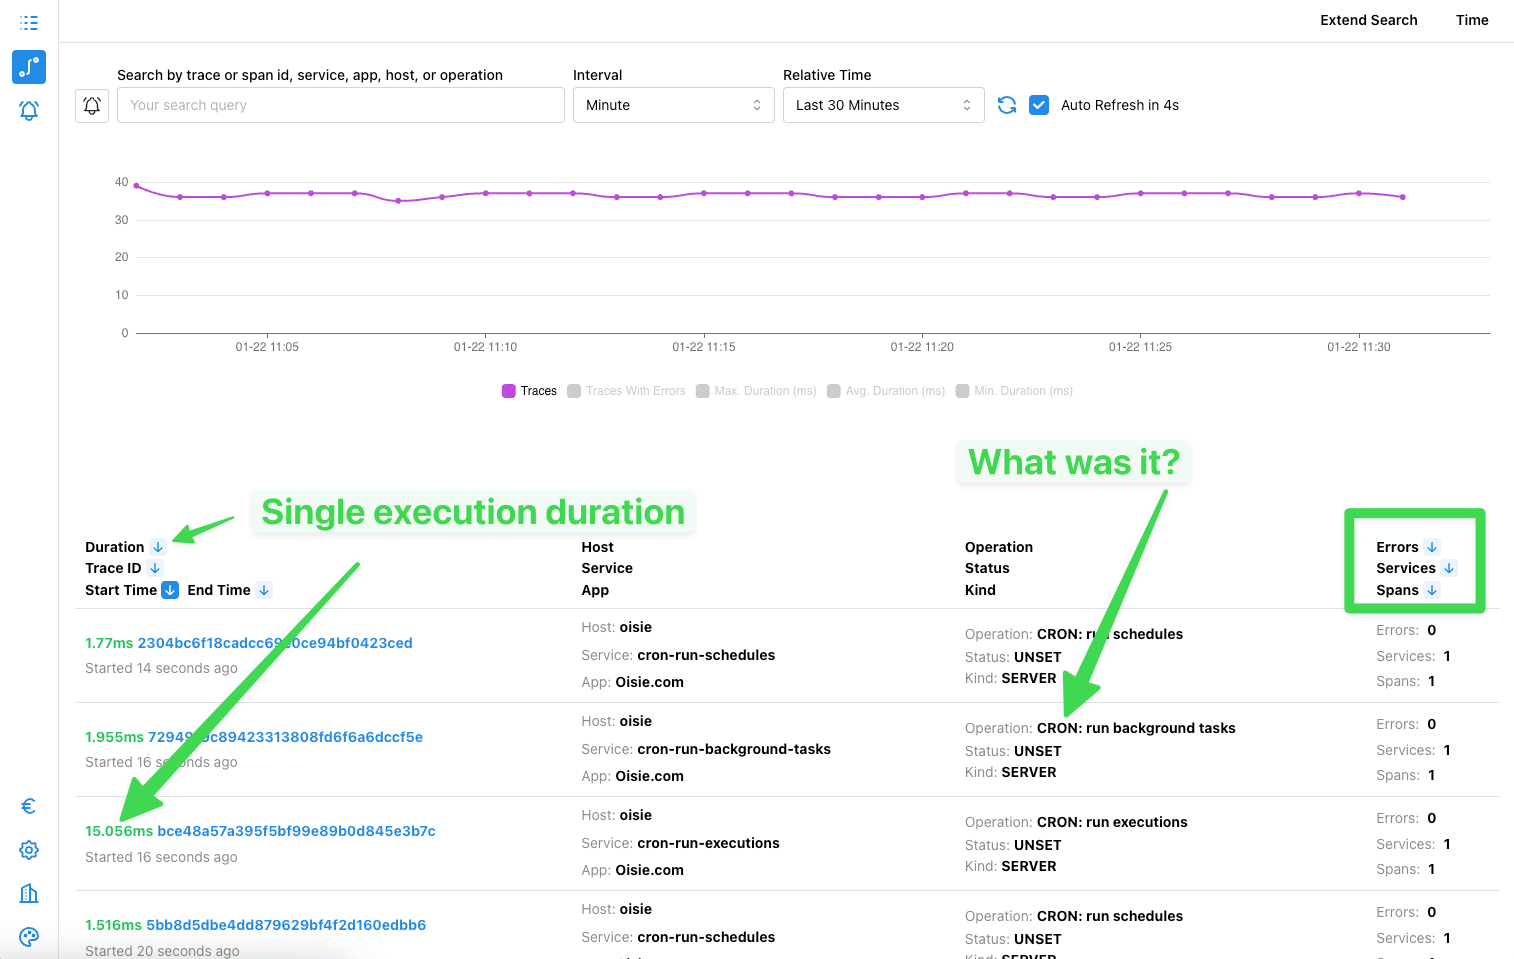
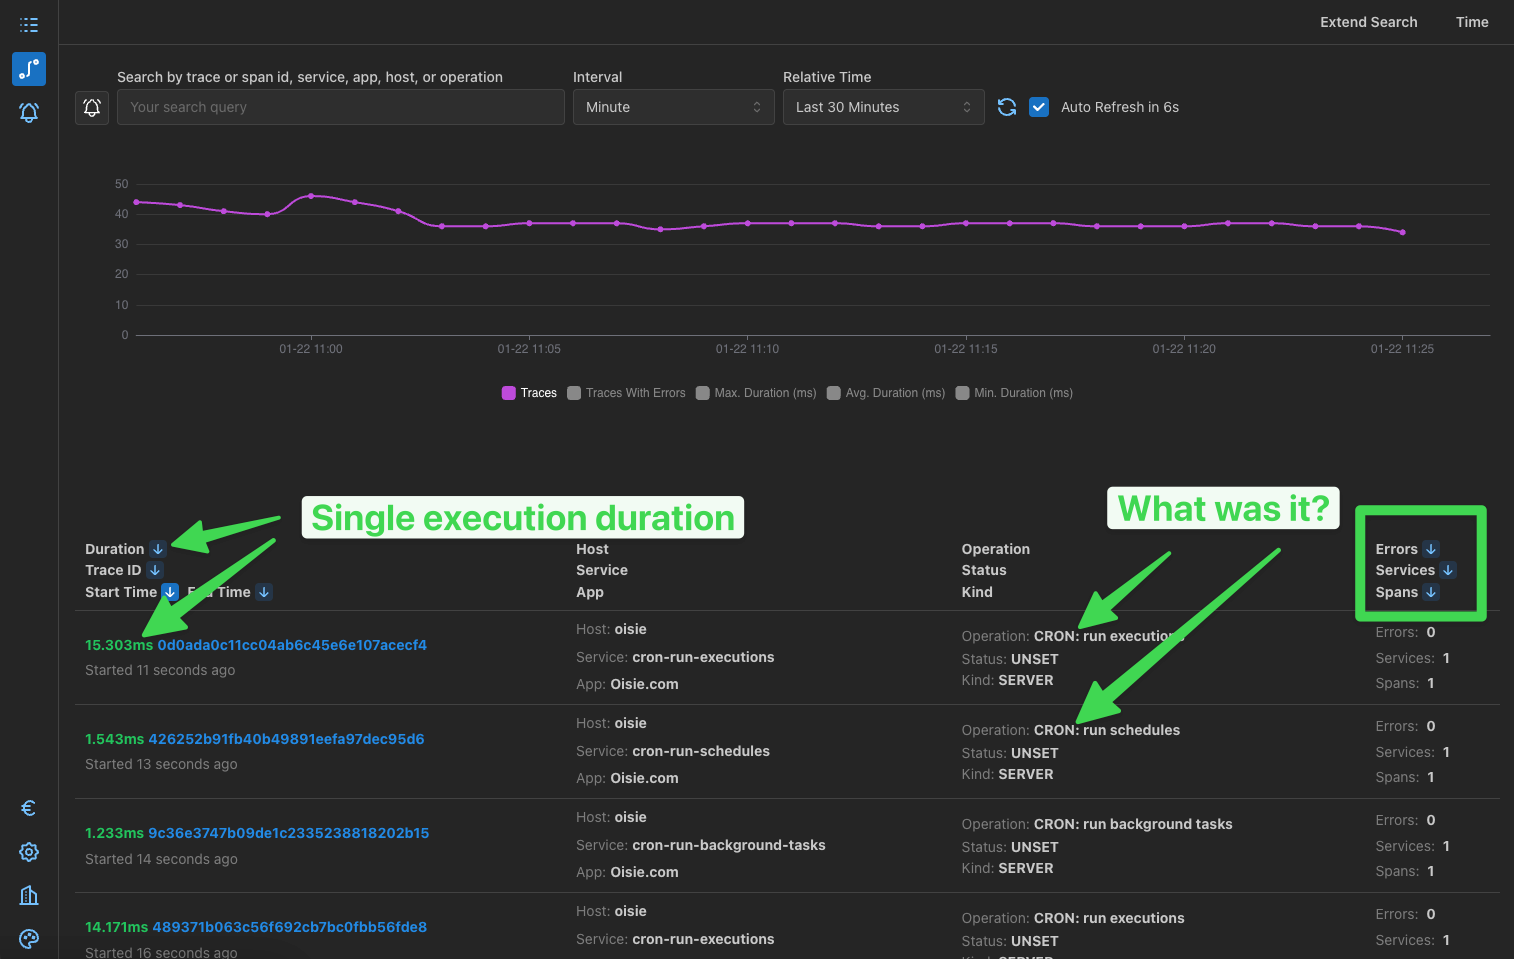
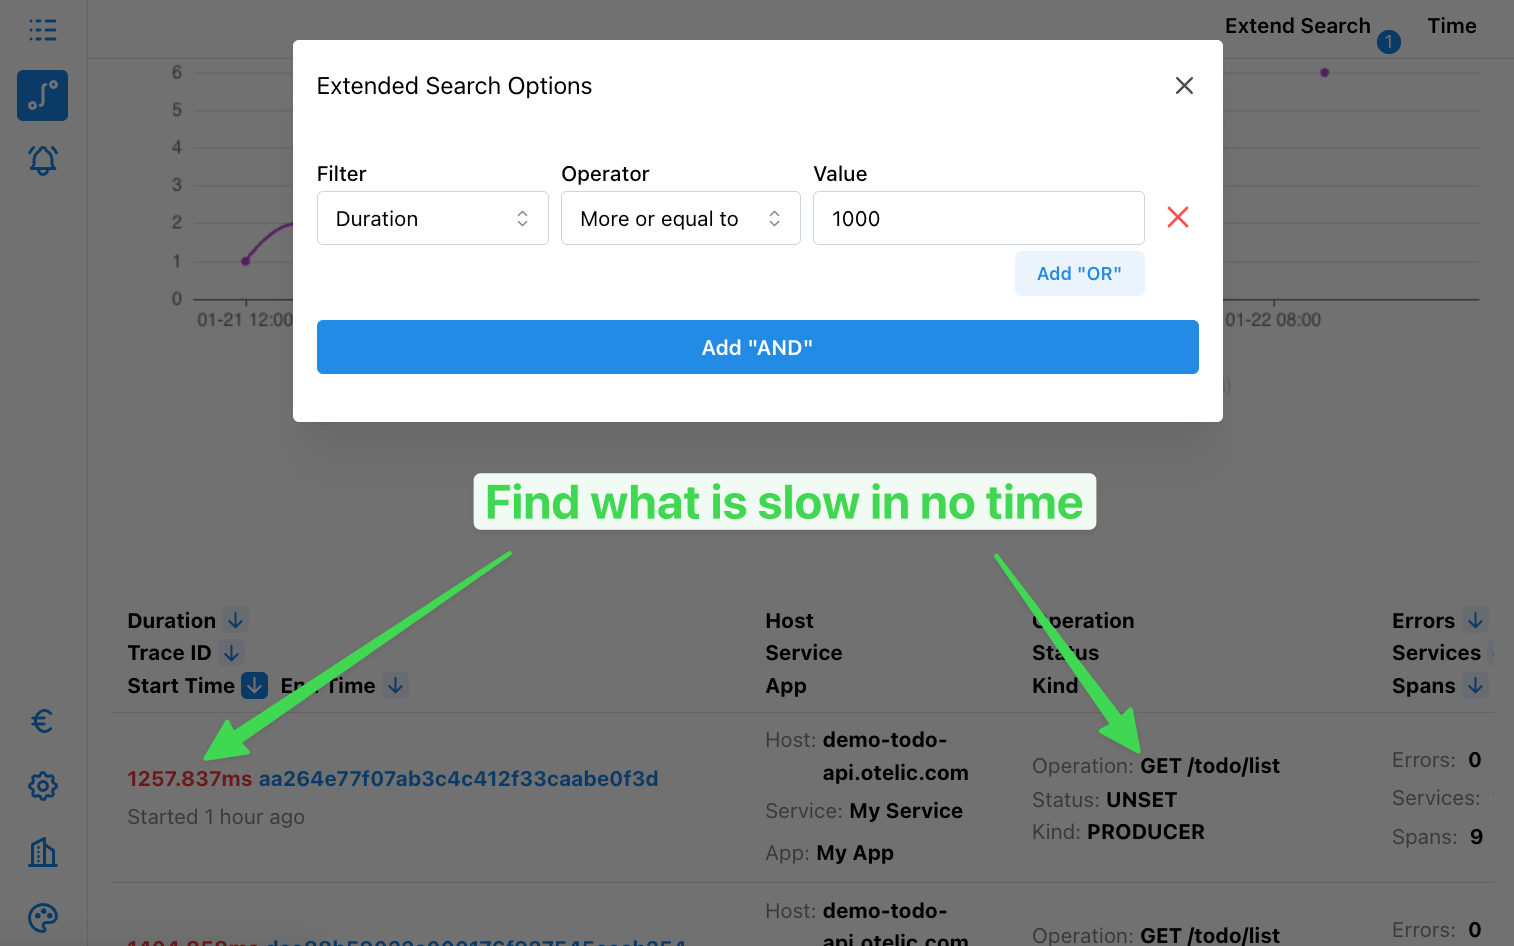
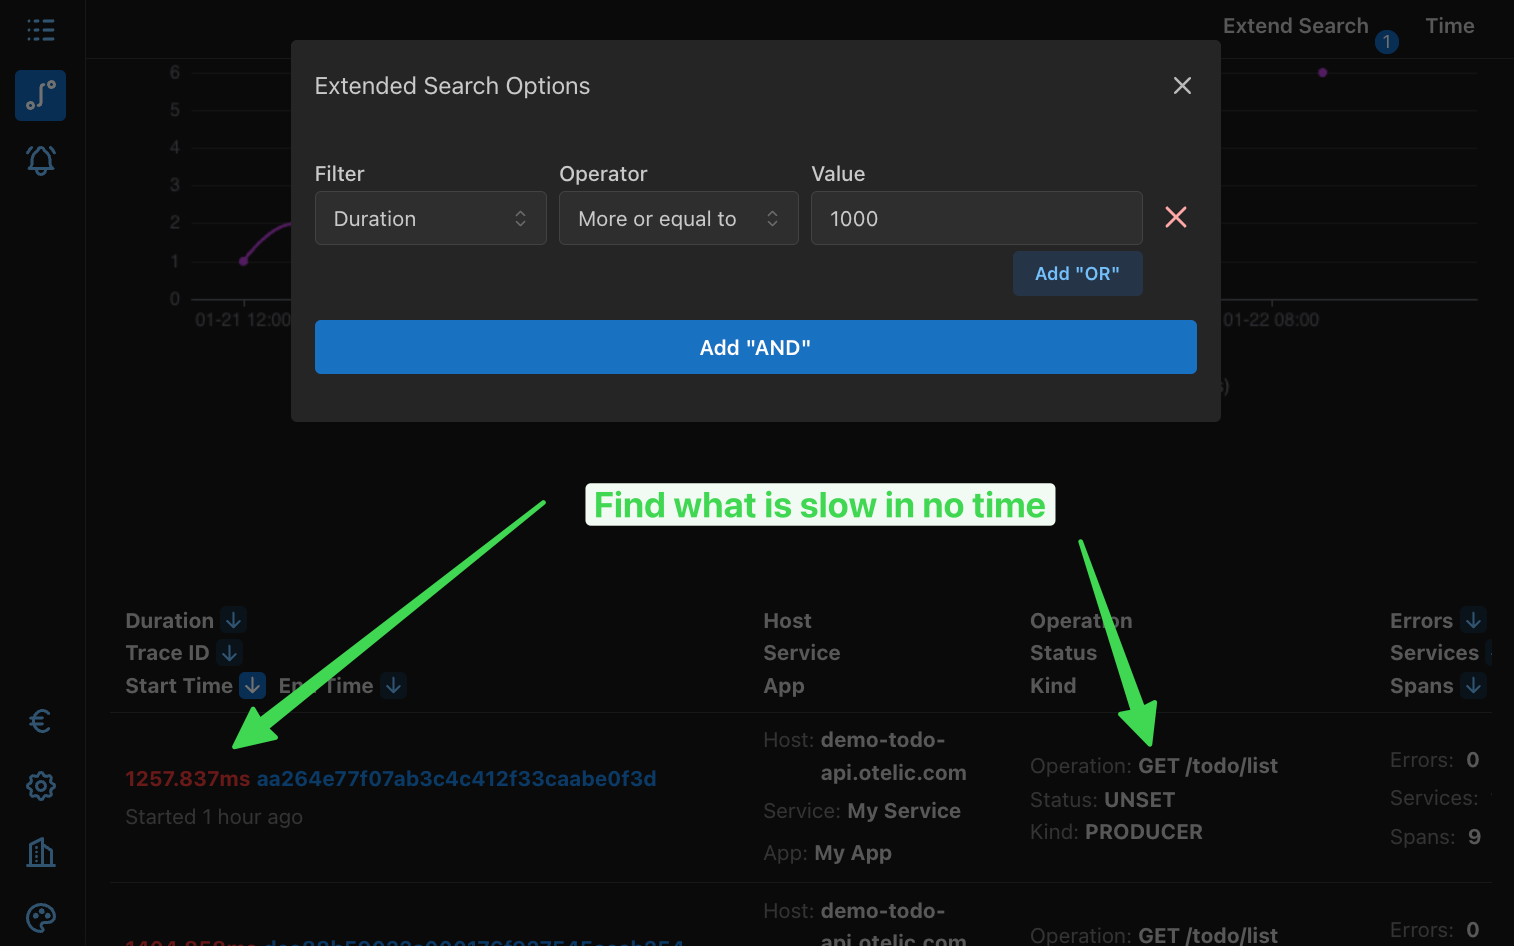
- Open the Traces view and sort by duration to find slow calls.
- Select a trace of the slow endpoint (e.g., a "Get To-Do List" API call).
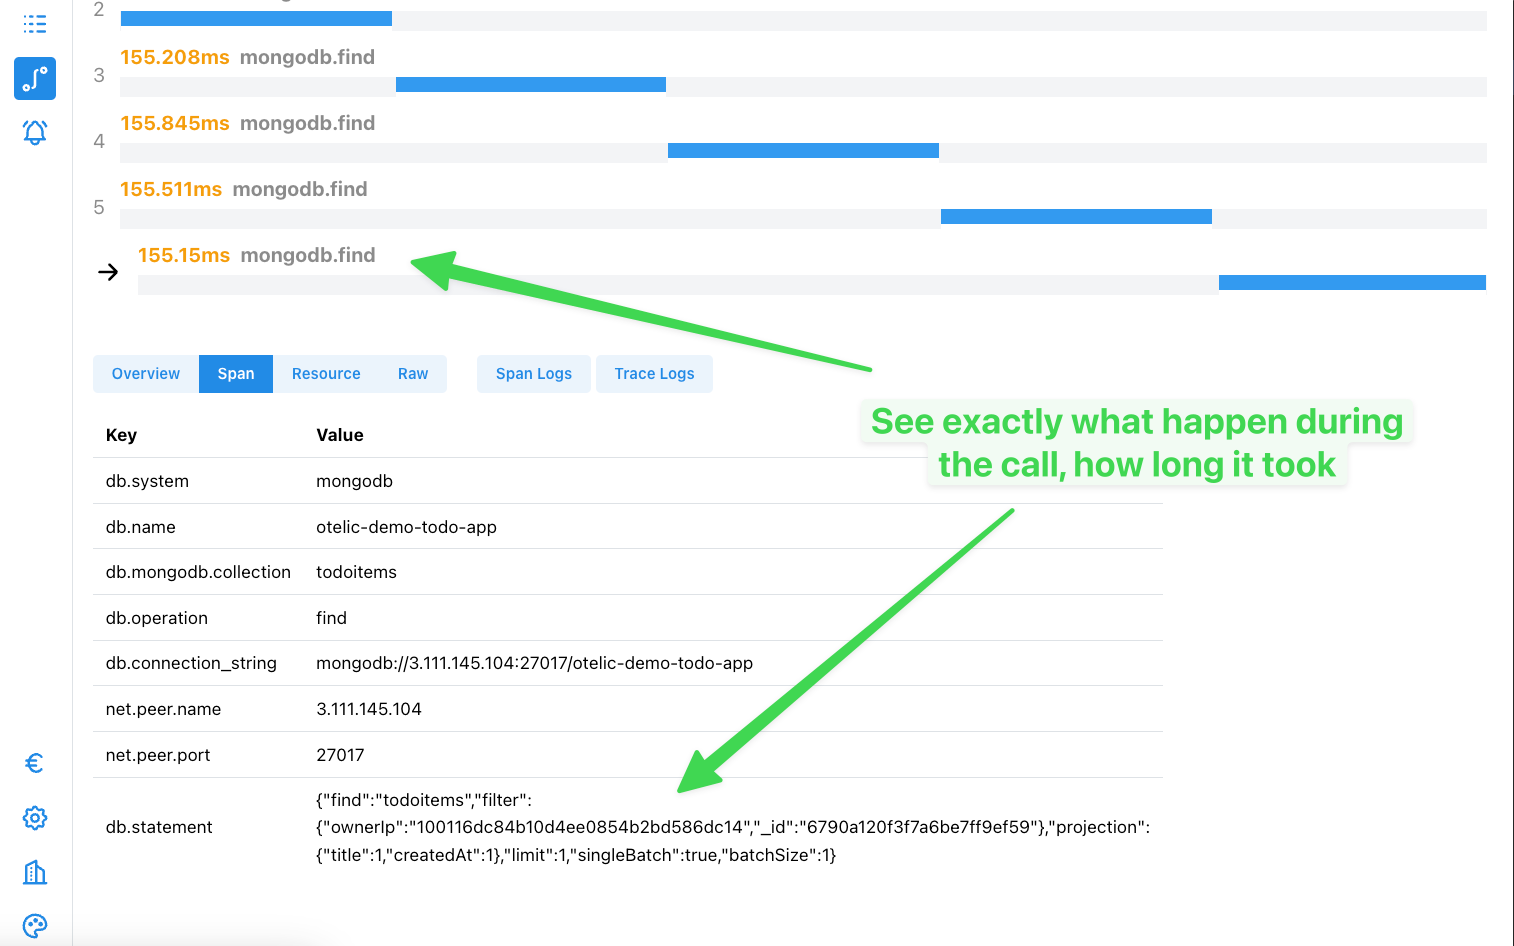
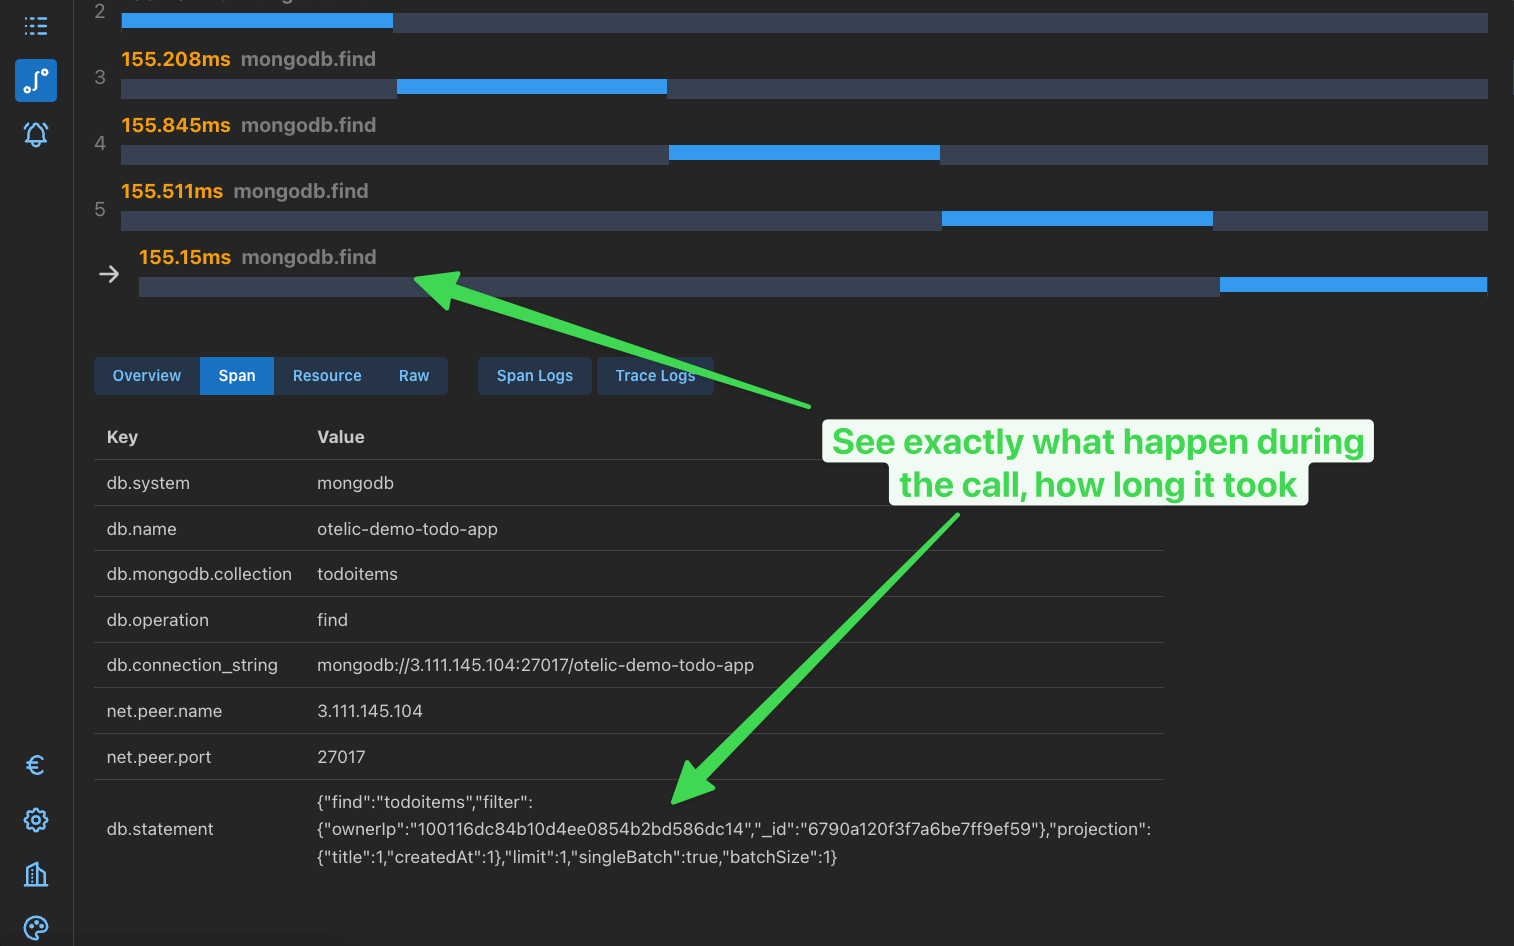
- Inspect the trace details to see that multiple database queries are being made, each taking ~150ms.
- Identify that these queries are happening sequentially rather than in parallel, which is causing the delay.
By analyzing this trace, you can optimize the database operations and significantly reduce the overall execution time.
4. Advanced Features of Otelic Traces
Otelic offers powerful tools to dive deeper into trace data:
- Search Options: Filter traces by time, duration, error status, and more to pinpoint specific issues.
- Graphical Insights: View error rates, average durations, and trace counts over time to spot trends.
- Span Attributes: See detailed metadata, such as database statements, to diagnose problems like missing indexes or inefficient queries.
5. Why Traces Are Essential for Developers
Traces provide a complete picture of what happens during a request. With Otelic, developers can: