Getting Started with Otelic: Logs, Traces, and Alerts Made Simple
Otelic is a powerful yet easy-to-use platform for managing logs, traces, and alerts. If you're new to observability tools, don’t worry—this guide will show you how Otelic simplifies the debugging process and makes your workflow faster and more efficient.
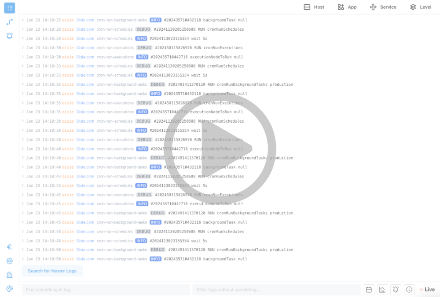
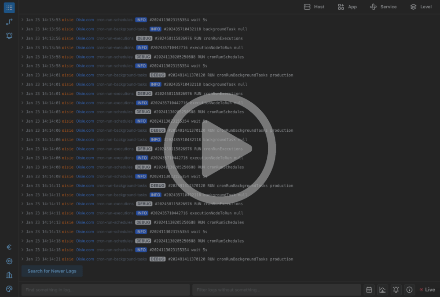
1. Logs: Real-Time Monitoring
In the Logs view, you can monitor a live tail of logs from all your servers. Otelic makes it easy to filter logs by:
You can also filter logs by time and see a visual graph showing how many logs were generated over time. Once you find a log, you can open it to view:
- Raw log message details.
- Attributes related to the log.
- A link to the associated trace for deeper analysis.
2. Traces: See the Full Picture
Traces show the journey of a request through your system. When you jump from a log to a trace, Otelic provides:
- A visual overview of how long the trace took and the individual steps (spans) within it.
- The ability to click on spans (e.g., database queries or API calls) to see detailed attributes, like a database statement.
Traces are incredibly useful for identifying slow or problematic requests. For example, you can filter traces to find all API calls that took longer than 1,000 milliseconds. From there, you can dig into the details to see what’s causing the delays.
3. Alerts: Stay Notified
Otelic allows you to set up alerts for both logs and traces. Alerts can be customized to notify you when something goes wrong, such as:
- Slow API calls.
- Error rates exceeding a certain threshold.
- Specific log patterns or events.
Alerts can be sent to a webhook, with custom headers and body content that includes logs, traces, and other data points.
4. Billing: Simple and Transparent
Otelic uses a pay-as-you-go model with no monthly subscriptions. You add credit to your account and only pay for what you use. Data retention starts with a free one-day option, and you can adjust it as needed—for. Check the price.
5. Workspace Settings: Customize Your Experience
In the workspace settings, you can:
- Adjust data retention settings.
- Create and switch between multiple workspaces.
- Change the app’s theme to suit your preferences.
Otelic is designed to be simple and flexible, so you can focus on debugging and improving your applications without getting lost in complicated settings.
6. Why Developers Love Otelic
As a developer, Otelic helps you focus on what matters: